


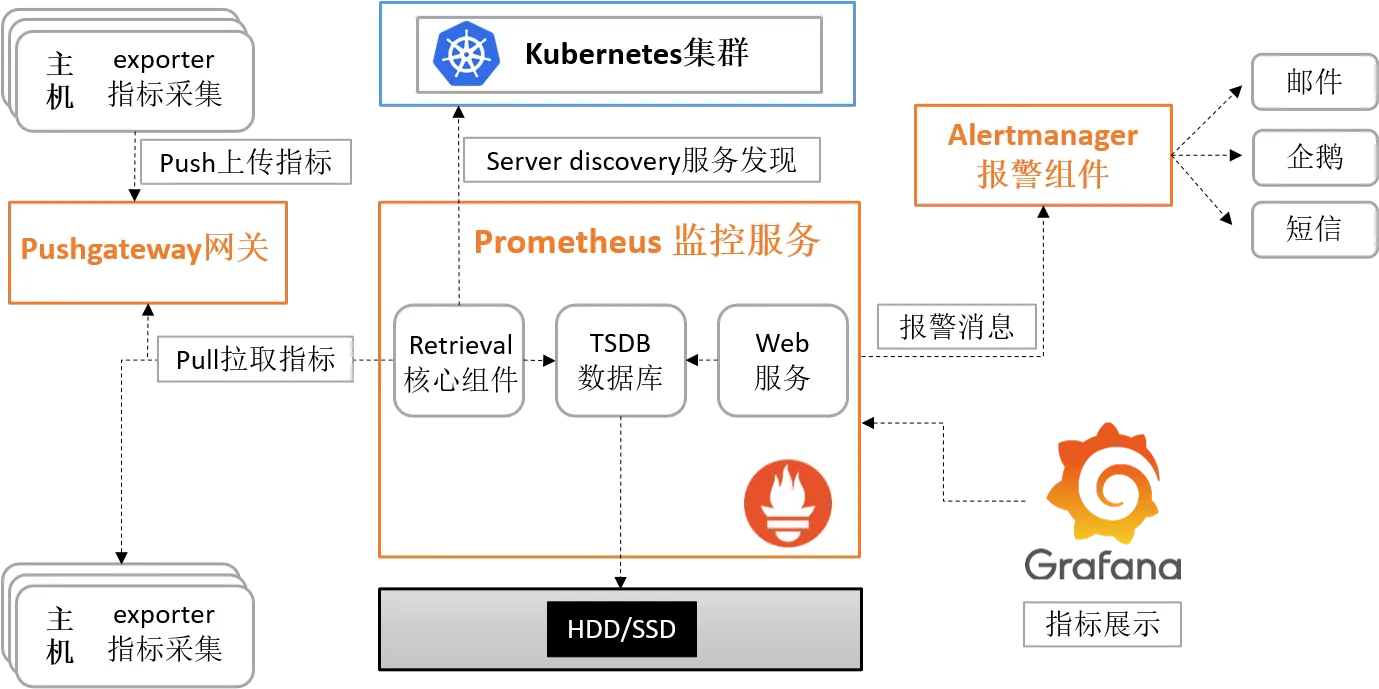
基础架构图:
普罗米修斯使用逻辑:
1、Prometheus server定期从静态配置的targets或者服务发现的targets拉取数据(Targets是Prometheus采集Agent需要抓取的采集目标)
2、当新拉取的数据大于配置内存缓存区的时候,Prometheus会将数据持久化到磁盘(如果使用remote storage将持久化到云端)。
3、Prometheus可以配置rules,然后定时査询数据,当条件触发的时候,会将alerts推送到配置的Alertmanager。
4、Alertmanager收到警告的时候,可以根据配置(163,钉钉等),聚合,去重,降噪,最后发送警告。
5、可以使用APl,Prometheus Console或者Grafana查询和聚合数据。
2.1 Prometheus Server(核心服务)
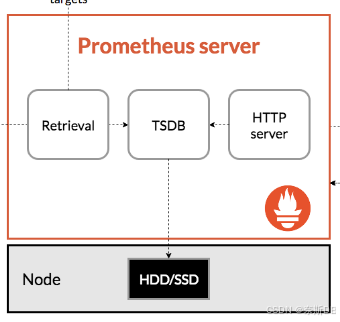
工作流程:
从 scrape_configs 定义的目标(如 node_exporter:9100)拉取 /metrics 数据。
将数据压缩后写入 TSDB(时间序列数据库)。
提供 HTTP API 供 Grafana 或其他工具查询数据。
2.2 Exporters(指标暴露器)

: ✅ 将非 Prometheus 原生指标转换为 Prometheus 可读格式。 ✅ 适用于无法直接暴露 /metrics 的系统(如 MySQL、Redis、Nginx)。
常见 Exporters:
2.3 Exporters的分类
官网版:
Prometheus社区提供了丰富的Exporter实现,涵盖了从基础设施,中间件以及网络等各个方面的监控功能。这些Exporter可以实现大部分通用的监控需求。进入到官网,然后选择download,然后点击“Exporters and integrations”
自定义版:
除了直接使用社区提供的Exporter程序以外,用户还可以基于Prometheus提供的Cient Library创建自己的Exporter程序,目前Promthues社区官方提供了对以下编程语言的支持:Go、Java/Scala、Python、Ruby。同时还有第三方实现的,比如:Bash、C++、Common Lisp、Erlang、Haskeel、Lua、Node.js、PHP、Rust等。这里的自定义就是下面的 “1.5 Client Libraries(客户端库)”
Exporters规范:
所有的Exporter都需要按照Prometheus的规范,返回监控的样本数据。以Node-Exporter为例,当访问http://110.120.100.12:9100/metrics地址时会返回以下内容:
# HELP go_gc_duration_seconds A summary of the pause duration of garbage collection cycles.
# TYPE go_gc_duration_seconds summary
go_gc_duration_seconds{quantile="0"} 1.3073e-05
go_gc_duration_seconds{quantile="0.25"} 1.7736e-05
go_gc_duration_seconds{quantile="0.5"} 1.9624e-05

# HELP node_cpu_seconds_total Seconds the CPUs spent in each mode.
# TYPE node_cpu_seconds_total counter
node_cpu_seconds_total{cpu="0",mode="idle"} 5367.63
2.4 Pushgateway(临时任务指标网关)
作用: ✅ 接收短期任务(如 Cron Job)推送的指标。 ✅ 解决 Prometheus Pull 模型无法监控短暂存活服务的问题。
适用场景:
批处理任务(如每日数据备份)
无法长期运行的服务
工作流程:
任务运行完成后,将指标推送到 Pushgateway。
Prometheus 从 Pushgateway 拉取数据。
2.5 Alertmanager(告警管理器)
作用: ✅ 接收 Prometheus 的告警通知,并进行去重、分组和路由。 ✅ 支持多种告警通知方式(邮件、Slack、Webhook 等)。
核心功能:
去重(Deduplication):合并相同告警,避免轰炸。
分组(Grouping):将相关告警合并为一条通知(如同一服务的多个实例)。
静默(Silencing):临时屏蔽特定告警。
2.6 Client Libraries(客户端库)
作用: ✅ 在应用程序中直接暴露 Prometheus 格式的指标,无需额外 Exporter。
支持语言:
Go (prometheus/client_golang)
Java (io.prometheus)
Python (prometheus_client)
Ruby (prometheus-client)
示例(Go语言):
import "github.com/prometheus/client_golang/prometheus"

// 定义一个计数器
var requestCount = prometheus.NewCounter(
    prometheus.CounterOpts{
        Name: "http_requests_total",
        Help: "Total HTTP requests",
    },
)

// 注册指标
prometheus.MustRegister(requestCount)

// 在 HTTP 处理函数中递增
requestCount.Inc()
2.7 Service Discovery(服务发现)
作用: ✅ 动态发现监控目标(如 Kubernetes Pods、云服务器)。
支持的服务发现机制:
Kubernetes:自动发现 Pods、Services。
Consul:通过 Consul 注册中心获取服务列表
文件静态配置:通过 file_sd_configs 加载目标列表。
示例(Kubernetes发现):
scrape_configs:
  - job_name: 'kubernetes-pods'
    kubernetes_sd_configs:
      - role: pod
    relabel_configs:
      - source_labels: [__meta_kubernetes_pod_annotation_prometheus_io_scrape]
        action: keep
        regex: true
2.7 PromQL(查询语言)
作用: ✅ 查询、聚合和分析时间序列数据。
常用查询示例:
# 计算 CPU 使用率
100 - (avg(irate(node_cpu_seconds_total{mode="idle"}[5m])) * 100)

# 统计 HTTP 请求错误率
sum(rate(http_requests_total{status=~"5.."}[5m])) / sum(rate(http_requests_total[5m]))
2.7 理解时间序列
安装好prometheus后会暴露一个/metrics的HTTP服务(相当于安装了prometheus_exporter),通过配置(默认会加上/metrics),Prometheus就可以采集到这个/metrics里面所有监控样本数据。例如:
# HELP process_open_fds Number of open file descriptors.
# TYPE process_open_fds gauge
process_open_fds 25
2.8 样本
Prometheus 会将所有采集到的监控样本数据以时间序列的方式保存在内存数据库中,并且定时保存到硬盘上。时间序列是按照时间戳和值的序列顺序存放的,我们称之为向量(vector),每条时间序列通过指标名称(metrics name)和一组标签集(label)命名。如下所示,可以将时间序列理解为一个以时间为 X 轴的数字矩阵:
  ^
  │   . . . . . . . . . . . . . . . . .   . .   process_open_fds
  │     . . . . . . . . . . . . . . . . . . .   node_cpu_seconds_total{cpu="cpu0",mode="system"}
  │     . . . . . . . . . .   . . . . . . . .   node_load1{}
  │     . . . . . . . . . . . . . . . .   . .
  v
    <------------------ 时间 ---------------->
如下所示:
process_open_fds 27<--------------------- metric ------------------------------><-timestamp -><-value->
process_open_fds{instance="localhost:9090", job="prometheus"} @1434417560938 39
process_open_fds{instance="localhost:9090", job="prometheus"} @1434417561287 33
process_open_fds{instance="localhost:9090", job="prometheus"} @1434417560938 35
process_open_fds{instance="localhost:9090", job="prometheus"} @1434417561287 37
process_open_fds{instance="localhost:9090", job="prometheus"} @1434417560938 36
process_open_fds{instance="localhost:9090", job="prometheus"} @1434417561287 25
<--metric_name-><----------------lable---------------------->
<--metric_name-><--name--><----value----> <name><--value--->2.9 指标(Metric)
<metric name>{<label name>=<label value>, ...}指标的名称(metric name)可以反映被监控样本的含义(比如,process_open_fds - 表示当前系统打开的文件描述符)。指标名称只能由ASCII字符、数字、下划线以及冒号组成并必须符合正则表达式[a-zA-Z_:][a-zA-Z0-9_:]*。
标签(label)反映了当前样本的特征维度,通过这些维度Prometheus可以对样本数据进行过滤,聚合等。标签的名称只能由ASCII字符、数字以及下划线组成并满足正则表达式[a-zA-Z_][a-zA-Z0-9_]*。
其中以__作为前缀的标签,是系统保留的关键字,只能在系统内部使用。标签的值则可以包含任何Unicode编码的字符。在Prometheus的底层实现中指标名称实际上是以__name__=<metric name>的形式保存在数据库中的,因此以下两种方式均表示的同一条time-series:
process_open_fds{instance="localhost:9090", job="prometheus"}等同于:
{__name__="process_open_fds",instance="localhost:9090",job="prometheus"}2.10 指标(Metric)的4种类型
Prometheus 底层存储上其实并没有对指标做类型的区分,都是以时间序列的形式存储,但是为了方便用户的使用和理解不同监控指标之间的差异,Prometheus 定义了 counter(计数器) 、gauge(仪表盘) 、 histogram(直方图) 以及 summary (摘要)这四种 Metrics 类型。
Gauge/Counter 是数值指标,代表数据的变化情况,Histogram/Summary 是统计类型的指标,表示数据的分布情况
# HELP process_resident_memory_bytes Resident memory size in bytes.
# TYPE process_resident_memory_bytes gauge
process_resident_memory_bytes 1.3586432e+08
2.11 Counter: 只增不减的计数器
Counter类型的指标其工作方式和计数器一样,只增不减(除非系统发生重置)。常见的监控指标,如http_requests_total,node_cpu都是Counter类型的监控指标。 一般在定义Counter类型指标的名称时推荐使用_total作为后缀。
通过 Counter 指标可以统计 HTTP 请求数量,请求错误数,接口调用次数等单调递增的数据,同时可结合 increase 和 rate 等函数统计变化速率
例如,通过PromQL内置的聚合rate()函数获取HTTP请求量的评价增长率:
rate(prometheus_http_requests_total[5m])查询当前系统中,访问量前10的HTTP地址:
topk(10, prometheus_http_requests_total)2.12 Gauge:可增可减的仪表盘
与Counter不同,Gauge类型的指标侧重于反应系统的当前状态。因此这类指标的样本数据可增可减。常见指标如:node_memory_MemFree_bytes(主机当前空闲的物理内存大小)、node_memory_MemAvailable_bytes(可用内存大小)都是Gauge类型的监控指标。
通过Gauge指标,通过PromQL可以直接查看系统的当前空闲物理内存大小:
node_memory_MemFree_bytes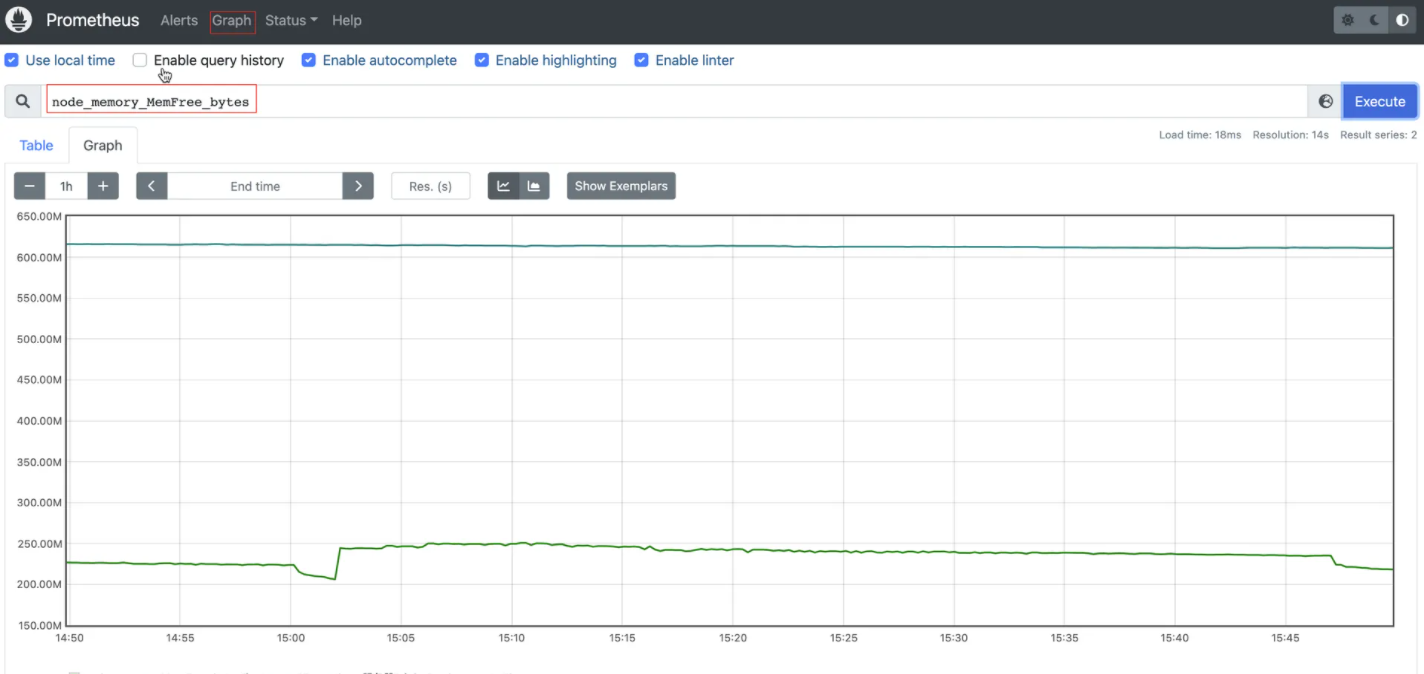
delta(cpu_temp_celsius{host="zeus"}[2h])还可以使用deriv()计算样本的线性回归模型,甚至是直接使用predict_linear()对数据的变化趋势进行预测。例如,预测系统磁盘空间在4个小时之后的剩余情况:
predict_linear(node_filesystem_avail_bytes{}[1h], 4 * 3600)2.13 使用Histogram(直方图)和Summary(摘要)分析数据分布情况
除了Counter和Gauge类型的监控指标以外,Prometheus还定义了Histogram和Summary的指标类型。Histogram和Summary主用用于统计和分析样本的分布情况。
在大多数情况下人们都倾向于使用某些量化指标的平均值,例如CPU的平均使用率、页面的平均响应时间。这种方式的问题很明显,以系统API调用的平均响应时间为例:如果大多数API请求都维持在100ms的响应时间范围内,而个别请求的响应时间需要5s,那么就会导致某些WEB页面的响应时间落到中位数的情况,而这种现象被称为长尾问题。
为了区分是平均的慢还是长尾的慢,最简单的方式就是按照请求延迟的范围进行分组。例如,统计延迟在010ms之间的请求数有多少而1020ms之间的请求数又有多少。通过这种方式可以快速分析系统慢的原因。Histogram和Summary都是为了能够解决这样问题的存在,通过Histogram和Summary类型的监控指标,我们可以快速了解监控样本的分布情况。
例如,指标prometheus_tsdb_wal_fsync_duration_seconds的指标类型为Summary。 它记录了Prometheus Server中wal_fsync处理的处理时间,通过访问Prometheus Server的/metrics地址,可以获取到以下监控样本数据:
# HELP prometheus_tsdb_wal_fsync_duration_seconds Duration of WAL fsync.
# TYPE prometheus_tsdb_wal_fsync_duration_seconds summary
prometheus_tsdb_wal_fsync_duration_seconds{quantile="0.5"} 0.012352463
prometheus_tsdb_wal_fsync_duration_seconds{quantile="0.9"} 0.014458005
prometheus_tsdb_wal_fsync_duration_seconds{quantile="0.99"} 0.017316173
prometheus_tsdb_wal_fsync_duration_seconds_sum 2.888716127000002
prometheus_tsdb_wal_fsync_duration_seconds_count 216
从上面的样本中可以得知当前Prometheus Server进行wal_fsync操作的总次数为216次,耗时2.888716127000002s。其中中位数(quantile=0.5)的耗时为0.012352463,9分位数(quantile=0.9)的耗时为0.014458005s。
在Prometheus Server自身返回的样本数据中,我们还能找到类型为Histogram的监控指标
# HELP prometheus_tsdb_compaction_chunk_range_seconds Final time range of chunks on their first compaction
# TYPE prometheus_tsdb_compaction_chunk_range_seconds histogram
prometheus_tsdb_compaction_chunk_range_seconds_bucket{le="100"} 0
prometheus_tsdb_compaction_chunk_range_seconds_bucket{le="400"} 0
prometheus_tsdb_compaction_chunk_range_seconds_bucket{le="1600"} 0
prometheus_tsdb_compaction_chunk_range_seconds_bucket{le="6400"} 0
prometheus_tsdb_compaction_chunk_range_seconds_bucket{le="25600"} 61
prometheus_tsdb_compaction_chunk_range_seconds_bucket{le="102400"} 1095
prometheus_tsdb_compaction_chunk_range_seconds_bucket{le="409600"} 1208
prometheus_tsdb_compaction_chunk_range_seconds_bucket{le="1.6384e+06"} 3184
prometheus_tsdb_compaction_chunk_range_seconds_bucket{le="6.5536e+06"} 217665
prometheus_tsdb_compaction_chunk_range_seconds_bucket{le="2.62144e+07"} 217695
prometheus_tsdb_compaction_chunk_range_seconds_bucket{le="+Inf"} 217695
prometheus_tsdb_compaction_chunk_range_seconds_sum 3.91254640158e+11
prometheus_tsdb_compaction_chunk_range_seconds_count 217695与Summary类型的指标相似之处在于Histogram类型的样本同样会反应当前指标的记录的总数(以count作为后缀)以及其值的总量(以sum作为后缀)。不同在于Histogram指标直接反应了在不同区间内样本的个数,区间通过标签len进行定义。
同时对于Histogram的指标,我们还可以通过histogram_quantile()函数计算出其值的分位数。不同在于Histogram通过histogram_quantile函数是在服务器端计算的分位数。 而Sumamry的分位数则是直接在客户端计算完成。因此对于分位数的计算而言,Summary在通过PromQL进行查询时有更好的性能表现,而Histogram则会消耗更多的资源。反之对于客户端而言Histogram消耗的资源更少。在选择这两种方式时用户应该按照自己的实际场景进行选择。
需要特别注意的是,假设采样数据 metric 叫做 x(指标名), 如果 x 是 histogram 或 summary 类型必需满足以下条件:
采样数据的总和应表示为
x_sum。采样数据的总量应表示为
x_count。summary类型的采样数据的 quantile 应表示为x{quantile="y"}。histogram类型的采样分区统计数据将表示为x_bucket{le="y"}。histogram类型的采样必须包含x_bucket{le="+Inf"}, 它的值等于x_count的值。summary和historam中quantile和le必需按从小到大顺序排列。
2.14 job(任务)和instances(实例)
概述:
在Prometheus中,任何被采集的目标,即每一个暴露监控样本数据的HTTP服务都称为一个实例(Instance),例如在当前主机上运行的node exporter可以被称为一个实例(Instance)。而具有相同采集目的的实例集合称为任务(Job)。
job(任务)
例如,以下2个复制实例的node作业:
* job: node
    * instance 2: 1.2.3.4:9100
    * instance 4: 5.6.7.8:9100
instances(实例)
通过在prometheus.yml配置文件中,添加如下配置。我们让Prometheus可以从node exporter暴露的服务中获取监控指标数据。
scrape_configs:
  - job_name: 'prometheus'
    static_configs:
      - targets: ['prometheus:9090']
  - job_name: 'alertmanager'
    static_configs:
      - targets: ['alertmanager:9093']
  - job_name: 'node-exporter'
    static_configs:
      - targets:
        - node-exporter:9100
        - 192.168.11.62:9100
当我们需要采集不同的监控指标(例如:主机、MySQL、Nginx)时,我们只需要运行相应的监控采集程序,在Prometheus Server配置这些Exporter实例的访问地址。
2.15 实例的状态
除了通过使用“up”表达式查询当前所有Instance的状态以外,还可以通过Prometheus UI中的Targets页面查看当前所有的监控采集任务,以及各个任务下所有实例的状态:


评论区